U.S. Weekly Export Sales
29 Mar 2026
U.S. EXPORT SALES
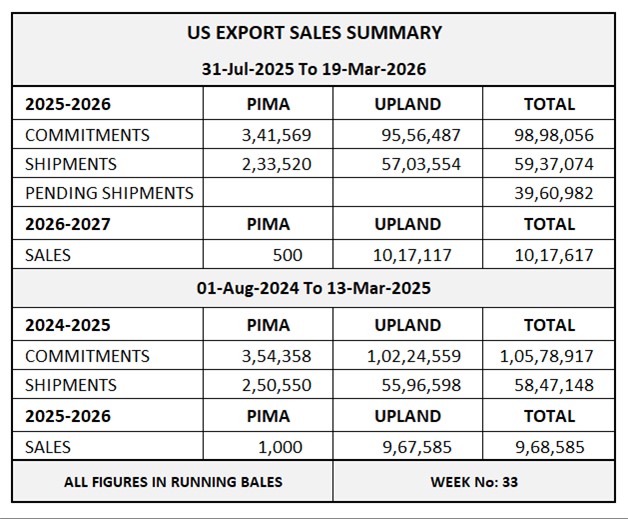
*For Week Ending 19-Mar-2026*
*Net Upland Sales 2025-26*
Net sales of Upland totaling 202,400 RB for 2025/2026 were up 3 percent from the previous week, but down 5 percent from the prior 4-week average.
*Increases*
Vietnam 91,400 RB
Pakistan 24,000 RB
Turkey 17,400 RB
Indonesia 12,400 RB
China 11,200 RB
*Reduction*
El Salvador 2,600 RB
Honduras 100 RB
*Net Upland Sales 2026-27*
Net sales of 27,000 RB for 2026/2027 were reported for
Peru 12,800 RB
Honduras 10,000 RB
Thailand 2,600 RB
Japan 1,300 RB
Guatemala 300 RB
*Net Upland Shipment*
Exports of 400,600 RB--a marketing-year high--were up 46 percent from the previous week and 43 percent from the prior 4-week average. The destinations were primarily to
Vietnam 164,100 RB
Pakistan 60,500 RB
Bangladesh 40,300 RB
India 27,400 RB
Turkey 26,600 RB
*Net Pima Sales 2025-26*
Net sales of Pima totaling 30,900 RB for 2025/2026--a marketing-year high--were up noticeably from the previous week and from the prior 4-week average.
*Increases*
Vietnam 21,800 RB
India 4,800 RB
China 3,300 RB
Pakistan 500 RB
Bangladesh 400 RB
*Net Pima Shipment*
Exports of 7,800 RB were up 49 percent from the previous week, but down 22 percent from the prior 4-week average. The destinations were primarily to
India 3,300 RB
China 1,500 RB
Bangladesh 1,300 RB
Pakistan 1,000 RB
Indonesia 200 RB
PDF Document
View or download the full document